
Your dashboard, in one conversation
Say who the page is for and what they decide. The assistant writes the queries, lays it out in your brand and checks that every tile renders before it hands it over.
Cedar Point Residential · Juniper Flats · 212 units
Operating pulse
Needs attention
4- Upcoming notice exposure · 6 notices, 4 not yet re-leasedLeasing
- Make-ready queue · 4 units, oldest 11 daysMaintenance
- Delinquency follow-up · 9 residents over 30 daysOffice
- Traffic is not converting · 41 tours, 6 net rentalsLeasing
Physical occupancy
93.4%
▴ 0.8 pts vs last month
Leased
95.1%
▴ 1.2 pts
Total delinquency
$18,420
▾ 12% vs last month
NOI, month to date
$142.8k
3.1% above budget
Current vacancy
| Unit | Type | Days vacant | Market rent | Status | |
|---|---|---|---|---|---|
| 1108 | 2x2 | 34 | $1,725 | Vacant, ready | Explain |
| 2214 | 1x1 | 19 | $1,385 | Move-in Nov 4 | Explain |
| 3302 | 3x2 | 12 | $2,040 | Make-ready | Explain |
| 1416 | 1x1 | 6 | $1,395 | Move-in Nov 1 | Explain |
| 2109 | 2x2 | 3 | $1,710 | Pre-leased | Explain |
Yardi, QuickBooks and budget sheet · captured today 6:00
A page for the regional manager, a different one for the owner
Generic dashboards try to serve everyone. Custom dashboards serve one person well. Lead with what needs attention, name sections the way your team talks, and use the period controls that match how they review: week, month or trailing twelve.
Ask for a change in plain English and the assistant edits the live page. Want the same page for another property or client? Clone it.
- Your colors, fonts and logo
- Tabs, toggles, drilldowns and side drawers
- CSV download on any table
- Tables your team writes to: notes, decisions and status, captured on the page and joinable by any tile
- Mobile, TV and presentation layouts
Cedar Point Residential · 5 properties · 1,046 units
Where NOI comes from.
Portfolio NOI, T12
$6.42M
2.4% above underwriting
NOI per unit, T12
$6,138
▴ 3.2% vs last year
Opex ratio
41.2%
▾ 0.7 pts
Occupancy, weighted
92.8%
▴ 0.4 pts
Repairs and maintenance per unit, T12
Portfolio snapshot
| Property | Units | Occupancy | NOI / unit | vs budget |
|---|---|---|---|---|
| Mesa Verde Townhomes | 96 | 95.8% | $7,220 | +4.6% |
| Juniper Flats | 212 | 93.4% | $6,740 | +3.1% |
| Sagebrush Apartments | 270 | 93.0% | $6,050 | +0.7% |
| Larkspur Commons | 288 | 91.7% | $5,910 | −1.8% |
| Riverbend Lofts | 180 | 90.6% | $5,480 | −3.9% |
Every figure links to its property page · captured today 6:00
Every number traces back to a saved query
Each tile on a custom dashboard runs a saved, governed query. Open any tile to see its SQL, its source and when the source last refreshed. If a query fails, the tile shows a dash and says why. It never shows a zero.
Every edit is saved, whether a person made it or the assistant did. Compare versions and restore the page or a single tile.
When the dashboard needs a number that lives in nobody's system, add a Cerebro table instead of a spreadsheet. A form on the row writes to it, and the tiles read it back like any other source.
Version history
- Current
Added a vacancy table
Dashboard assistant · Just now
- Restore
Renamed Leasing to Demand
Leasing lead · Yesterday
- Restore
Rebuilt the delinquency tile
Dashboard assistant · Oct 12
- Restore
Removed the reviews tab
Regional manager · Oct 9
Tile: Total delinquency
Source: Yardi aging report · refreshed today 6:00
select sum(balance) as total
from resident_aging
where property = :property
  and as_of = :period_end
  and bucket <> 'current'
One assistant, very different pages
These are rebuilt with invented names and numbers. The real ones run on Cerebro today.
Property operating pulse
Portfolio NOI map
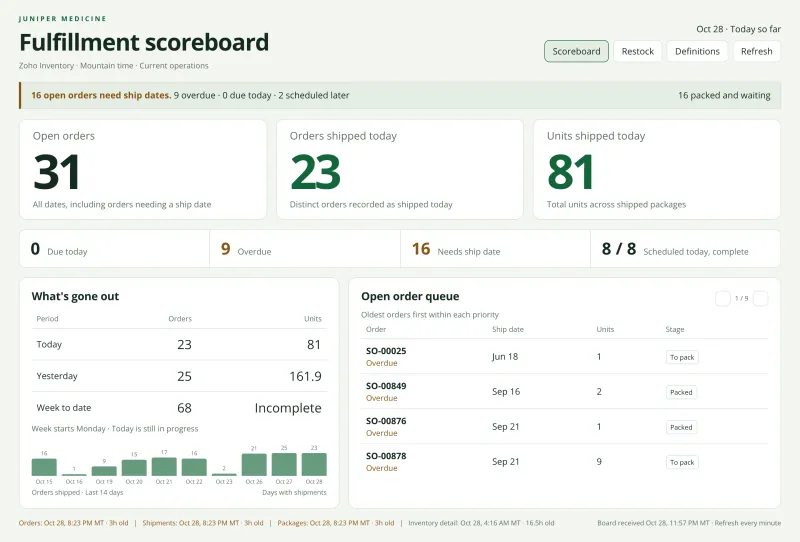
Fulfillment scoreboard
Client retainer portal
Rep action board
Sales meeting command center
A dashboard people keep using
Fresh on demand
Alert me buttons
Report what looks wrong
Spreadsheets that stay synced
Ask the page
Hand it off
A dashboard for the desk, the wall and the board meeting
Ask for a dark TV layout for the shipping room, a phone layout for the leasing office or a presentation mode with numbered slides for the board. Each one is the same live data.
Northgate Ops Partners for Bluefin Logistics · October retainer
62% of this month's hours are used.
Monthly commitment
40.0 h
Hours used
24.8 h
▴ 6.5 h this week
Projected month end
41.6 h
1.6 h over at this pace
Overage last month
0.0 h
on commitment
Timesheets and help desk · synced 12 min ago
Keystone Office Supply · Action board
Good morning, Dana.
Call these first
| Account | Signal | Last order | |
|---|---|---|---|
| Lakeside Property Group | Gone quiet | 74 days | Log callDraft outreach |
| Pioneer Title Co. | Down 31% vs last year | 9 days | ✓ Called this cycle |
| Crossroads Church | Cross-sell: janitorial | 18 days | Log callDraft outreach |
ERP database, queried live · QuickBooks synced 20 min ago
The rest of the analyst
What customers say
“One prompt turns into a dashboard that's incredibly useful for somebody, and it took me 15 minutes.”
“This is going to give ops a look into the business they've never had.”
“I can just click and get everything I need. It's what a Looker Studio report would have looked like if we'd spent a few thousand dollars building it.”
Sign up and build your first dashboard today
Connect a source, describe what you want to see and have a live dashboard before your next meeting. Free to start.